Why the Crypto Market Is Down Today

The Bitcoin (BTC) price and crypto market cap (TOTALCAP) are both struggling to move above critical horizontal resistance areas despite breakouts from diagonal patterns. The Frax Share (FXS) price is decreasing under a descending resistance line without showing any bullish signs whatsoever.
The Huobi Exchange has delisted ten token trading pairs that trade with Justin Sun’s USDD. The tokens include SOL, MATIC, FIL, and ETC. It comes after the SEC’s recent classification of these tokens as securities.
Crypto Market Cap (TOTALCAP) Fails to Clear Crucial Resistance
The TOTALCAP bounced sharply on June 15, validating the $980 billion level as support. Five days later, it broke out from a descending parallel channel, culminating with a high of $1.17 trillion on June 23.
However, the price has decreased slightly since, struggling to move above the $1.15 trillion resistance.
If TOTALCAP breaks out, it could increase to the next resistance at $1.30 trillion, reaching a new yearly high in the process. However, a drop to the closest support at $980 billion could transpire if the price gets rejected.
Bitcoin (BTC) Attempts Breakout From Crucial Resistance
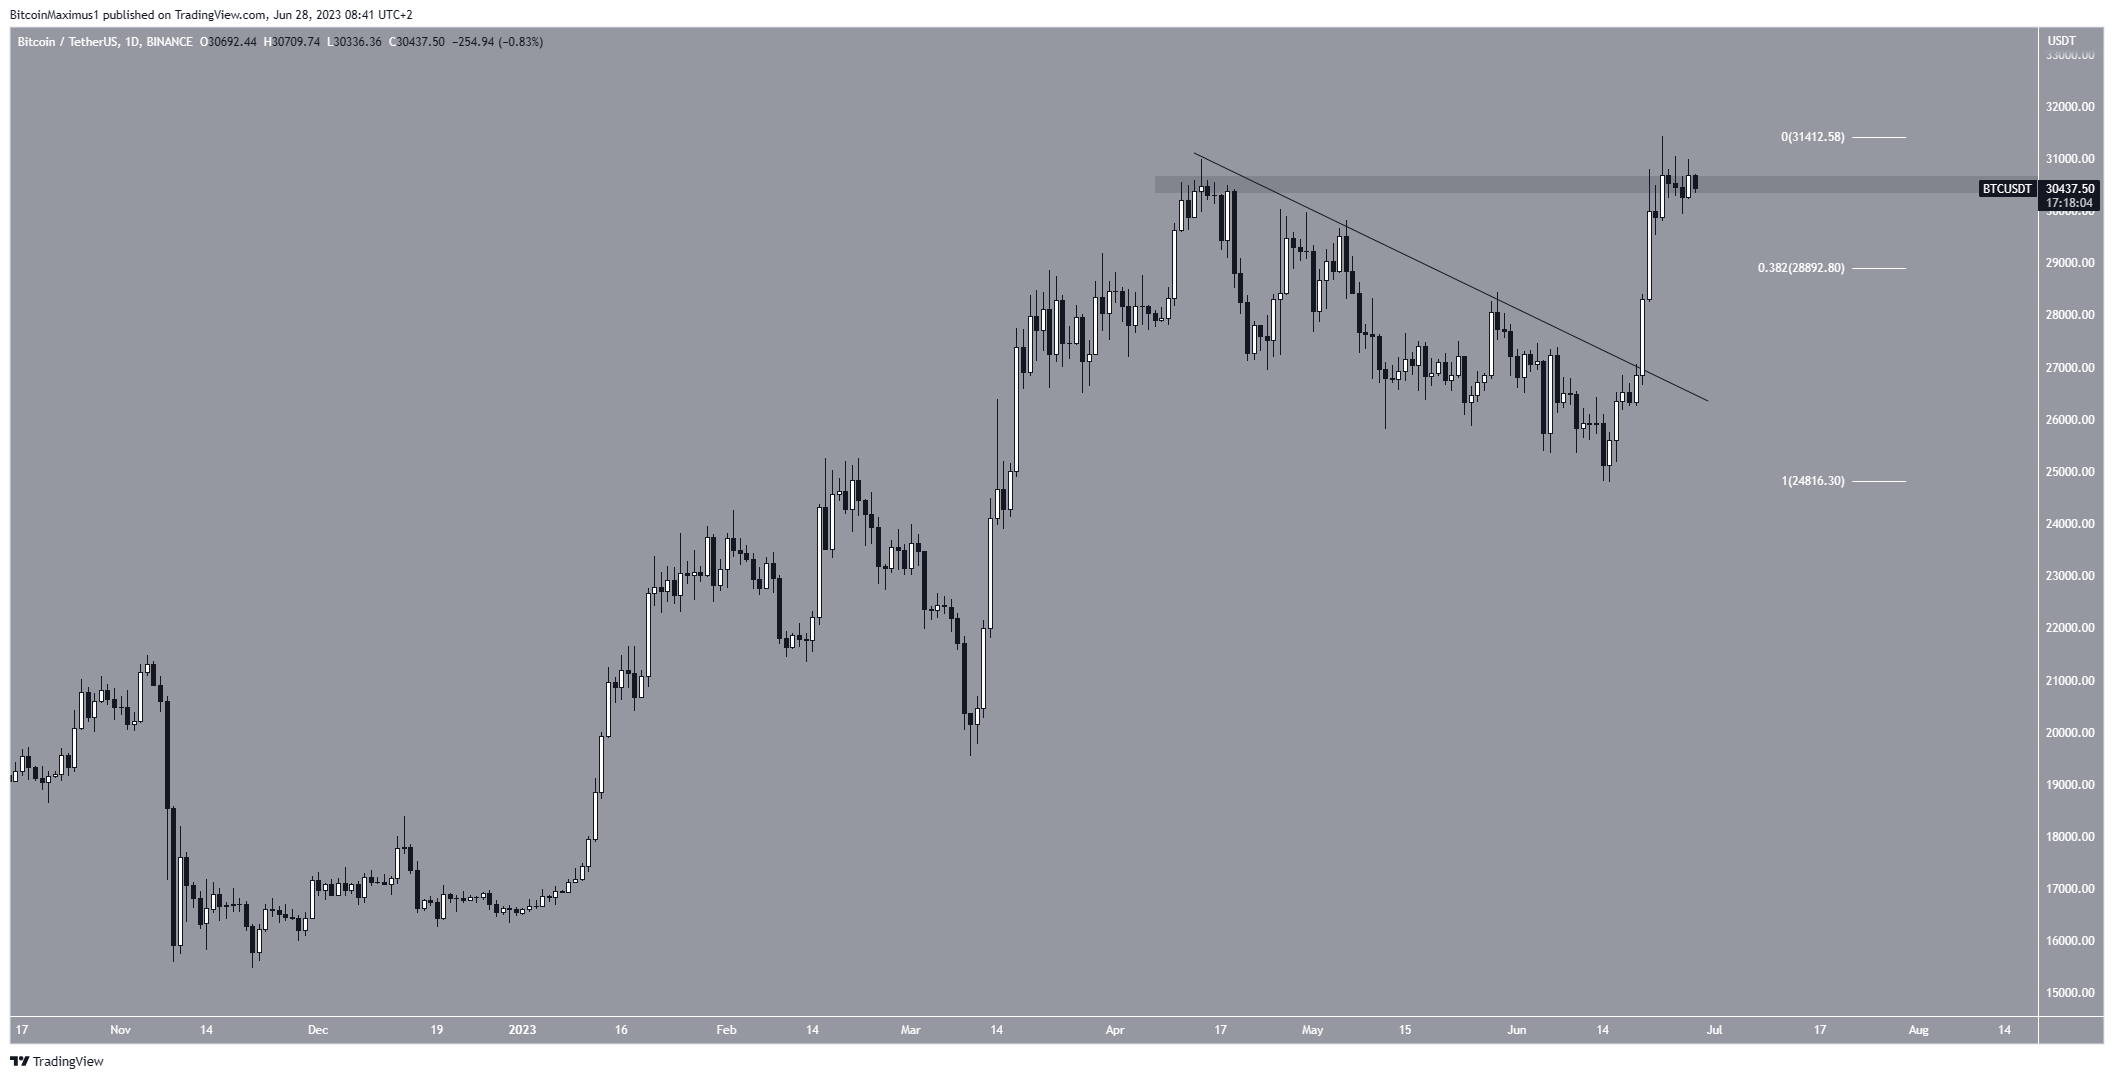
The Bitcoin price reached broke out from a descending resistance line on June 20 and reached a new yearly high of $31,431 three days later. However, the price did not close above the $30,400 resistance area despite the breakout. Rather, it is struggling with it and could potentially decrease.

If the price begins a short-term reversal, the closest support will be at the 0.382 Fib level at $29,000. Conversely, if the price increases and breaks out, the next resistance will be at $35,000.
Frax Share (FXS) Price Continues Descent Below Resistance
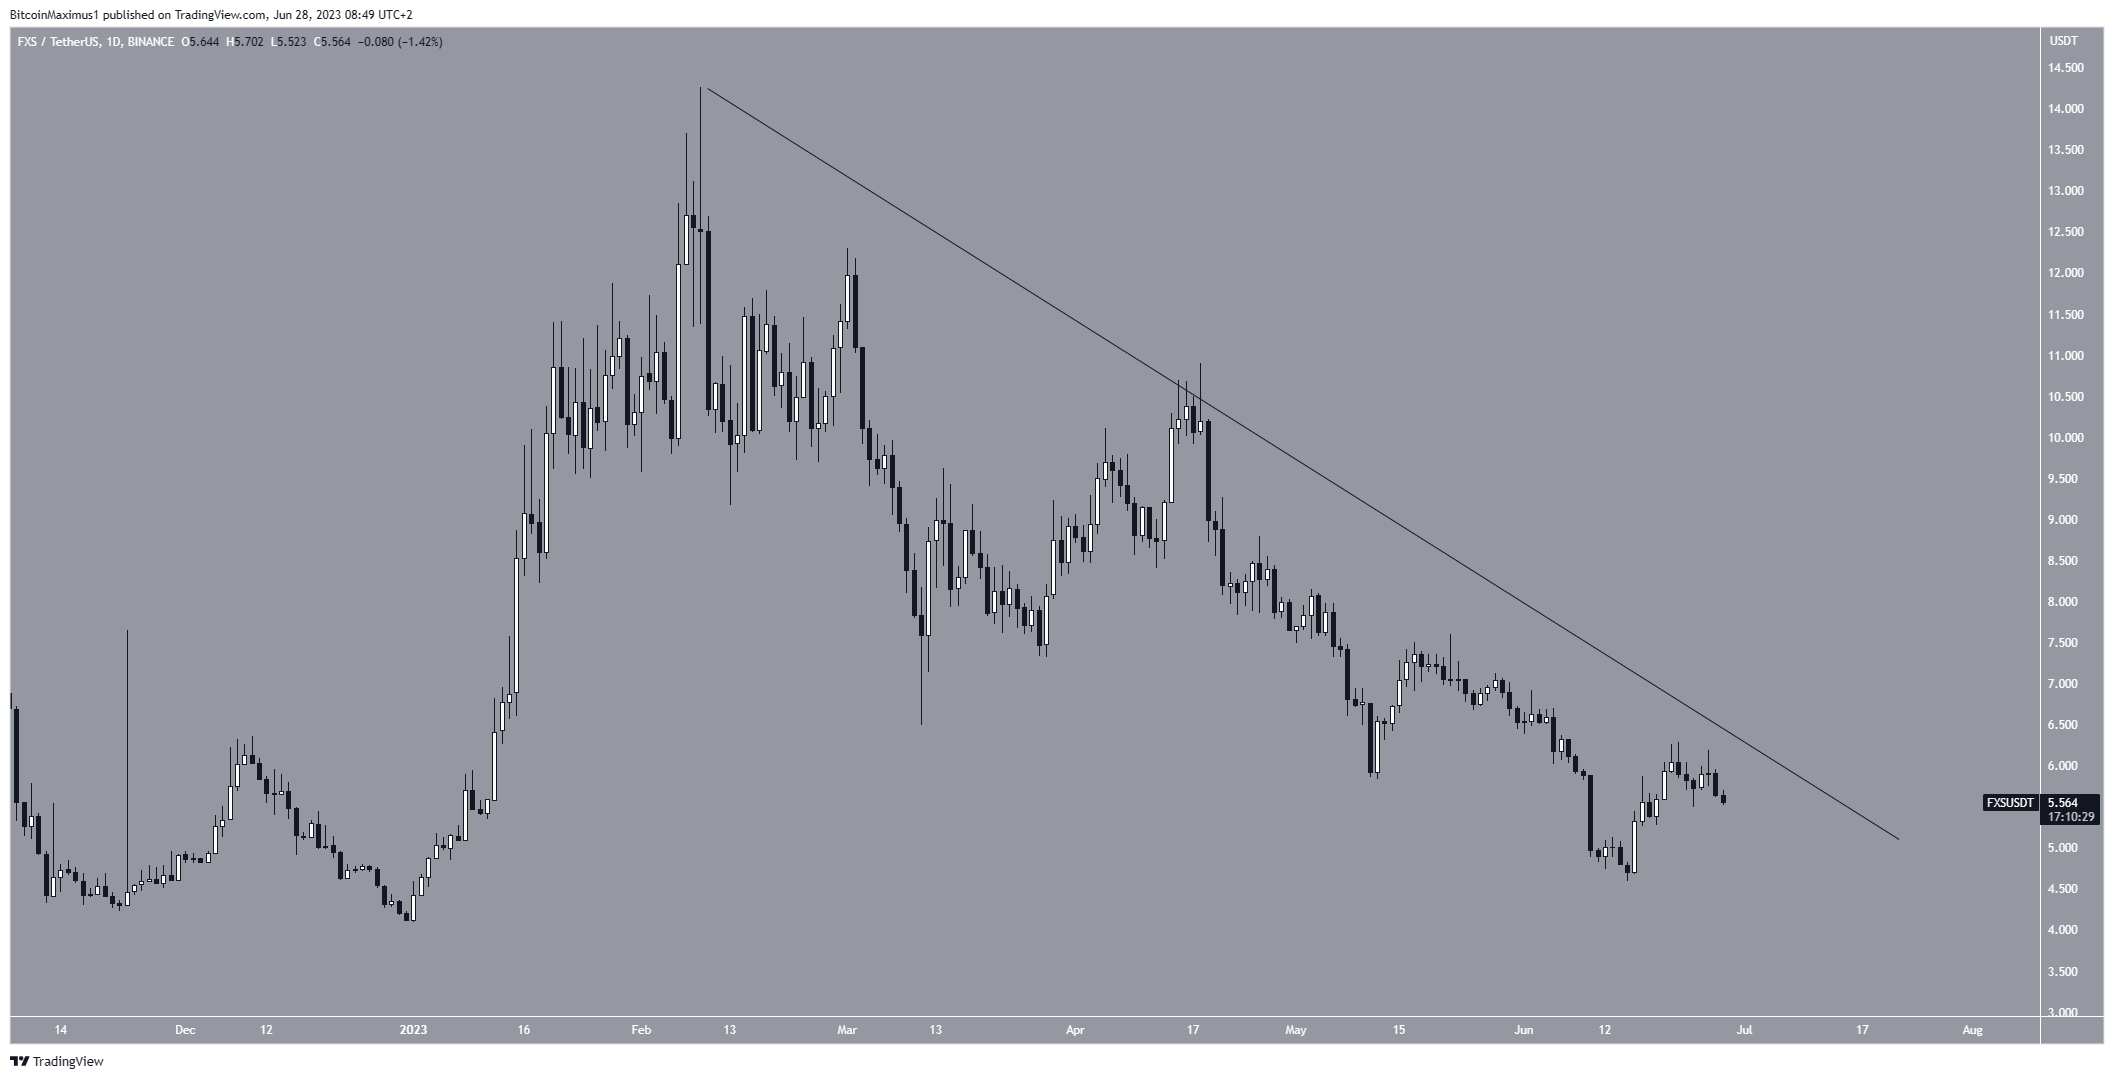
The FXS price has fallen under a descending resistance line since Feb. 10. More recently, the line caused a rejection on April 18 (red icon). This led to a low of $4.60 on June 15.
While the FXS price increased afterward, it has not yet reached the descending resistance line.

If it does and breaks out, FXS can increase to $10. However, a drop to $3 could transpire if it gets rejected and falls.
For BeInCrypto’s latest crypto market analysis, click here.
Disclaimer
In line with the Trust Project guidelines, this price analysis article is for informational purposes only and should not be considered financial or investment advice. BeInCrypto is committed to accurate, unbiased reporting, but market conditions are subject to change without notice. Always conduct your own research and consult with a professional before making any financial decisions.


